
De Belgische regenworm atlas: Een nationale inventaris van regenworm diversiteit sinds Bouché (1978)
———
The Belgian earthworm atlas: updating a national inventory of earthworm diversity since Bouché (1978)
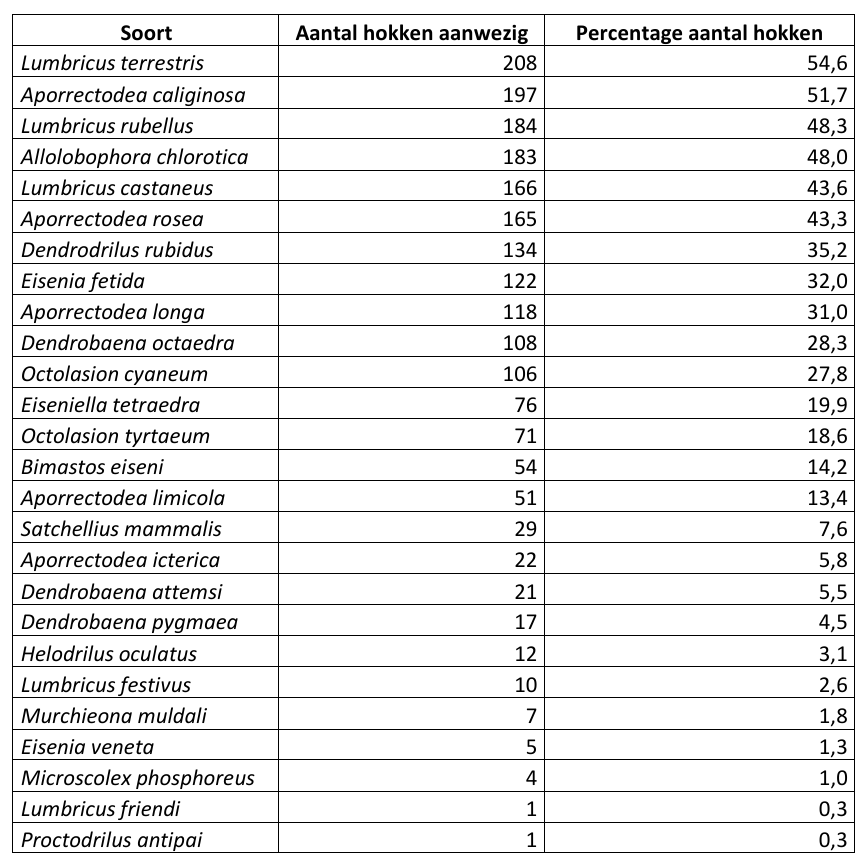
In het kader van een masterthesisonderzoek werd alle beschikbare data rond de verspreiding van regenwormsoorten samengezet. De data inzameling gebeurde aan de hand van opzoekwerk naar bestaande regenwormdata, eigen veldwerk, en een inzamelactie via citizen science. Dit vormt de basis voor de Belgische regenworm atlas. Hoewel deze nog niet afgewerkt is, kunnen al enkele resultaten gedeeld worden. In België zijn er tot op heden 35 soorten regenwormen waargenomen. Sommige van deze soorten zitten in een soortencomplex, wat betekent dat ze uitwendig morfologisch identiek zijn en alleen op basis van DNA kunnen worden onderscheden Hierdoor zakt het aantal morfologisch onderscheidbare soorten in België naar 26. Deze soorten(complexen) zijn in onderstaande tabel gerangschikt van hoge naar lage verspreidingsgraad (uitgedrukt in het aantal keer voorkomen in een 10kmx10km UTM-uurhokken).
As part of a master’s thesis research project, all available data on the distribution of earthworm species were compiled. The data collection was carried out through research into existing earthworm data, our own fieldwork, and a citizen science data collection campaign. This forms the basis for the Belgian earthworm atlas. Although this atlas is not yet completed, some results can already be shared. To date, 35 earthworm species have been recorded in Belgium. Some of these species are part of a species complex, meaning that they are morphologically identical externally and can only be distinguished based on DNA. As a result, the number of morphologically distinguishable species in Belgium decreases to 26. These species (complexes) are ranked in the table below from high to low distribution range, expressed as the number of occurrences in 10 km × 10 km UTM grid squares.
Ontdek de verspreidingskaarten
———
Discover the distribution maps
Voor elk(e) soort(complex) is een afzonderlijke verspreidingskaart opgesteld. Klik hieronder op de gewenste soort om de verspreiding ervan te bekijken. Voor de soorten met voldoende observaties zijn bijkomend soortenverspreidingsmodellen opgesteld. Hieruit bleken de de gemiddelde jaarlijkse temperatuur, de verhardingsgraad en de boombedekkingsgraad de belangrijkste variabelen te zijn. De eerste twee zijn vermoedelijk van sterk belang door een sampling bias naar Vlaanderen en verstedelijkte habitats toe.
For each species (complex), a separate distribution map has been created. Click on the desired species below to view its distribution. For species with a sufficient number of observations, species distribution models were additionally developed. These showed that mean annual temperature, degree of soil sealing, and tree canopy cover were the most important variables. The first two are presumably of particular importance due to a sampling bias towards Flanders and urbanised habitats.
Nog veel data nodig
———
Still a lot of data needed
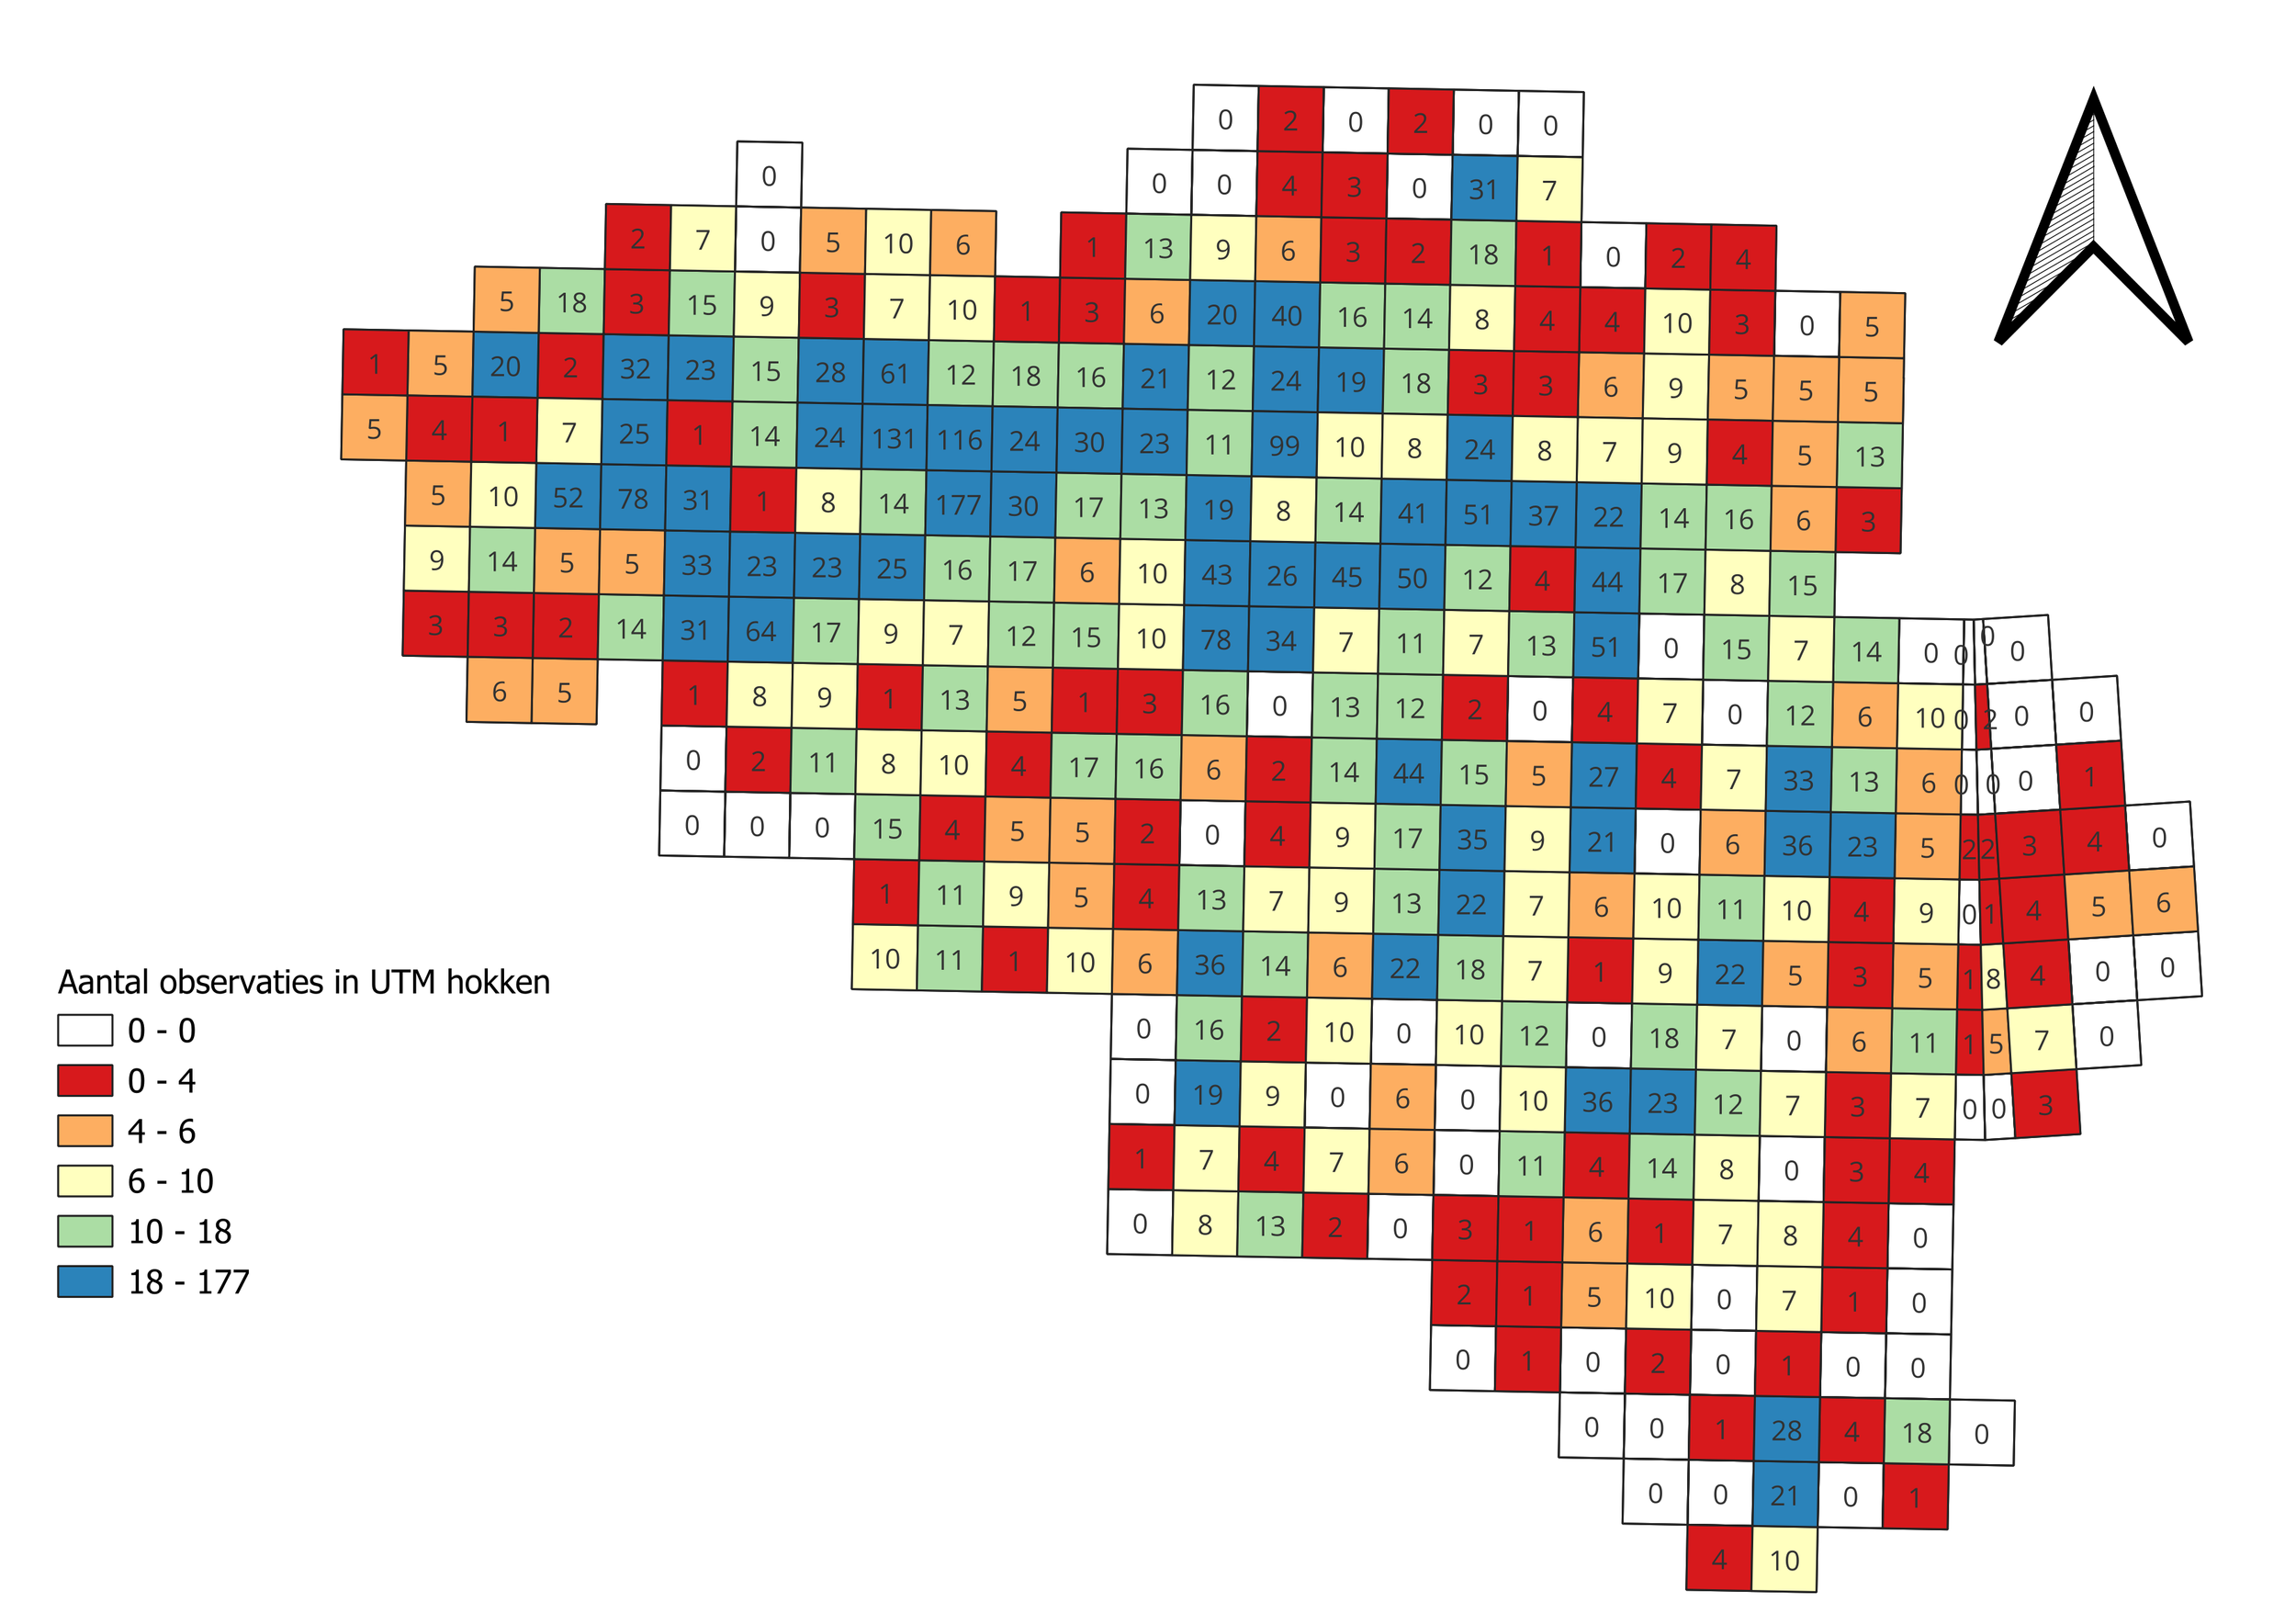
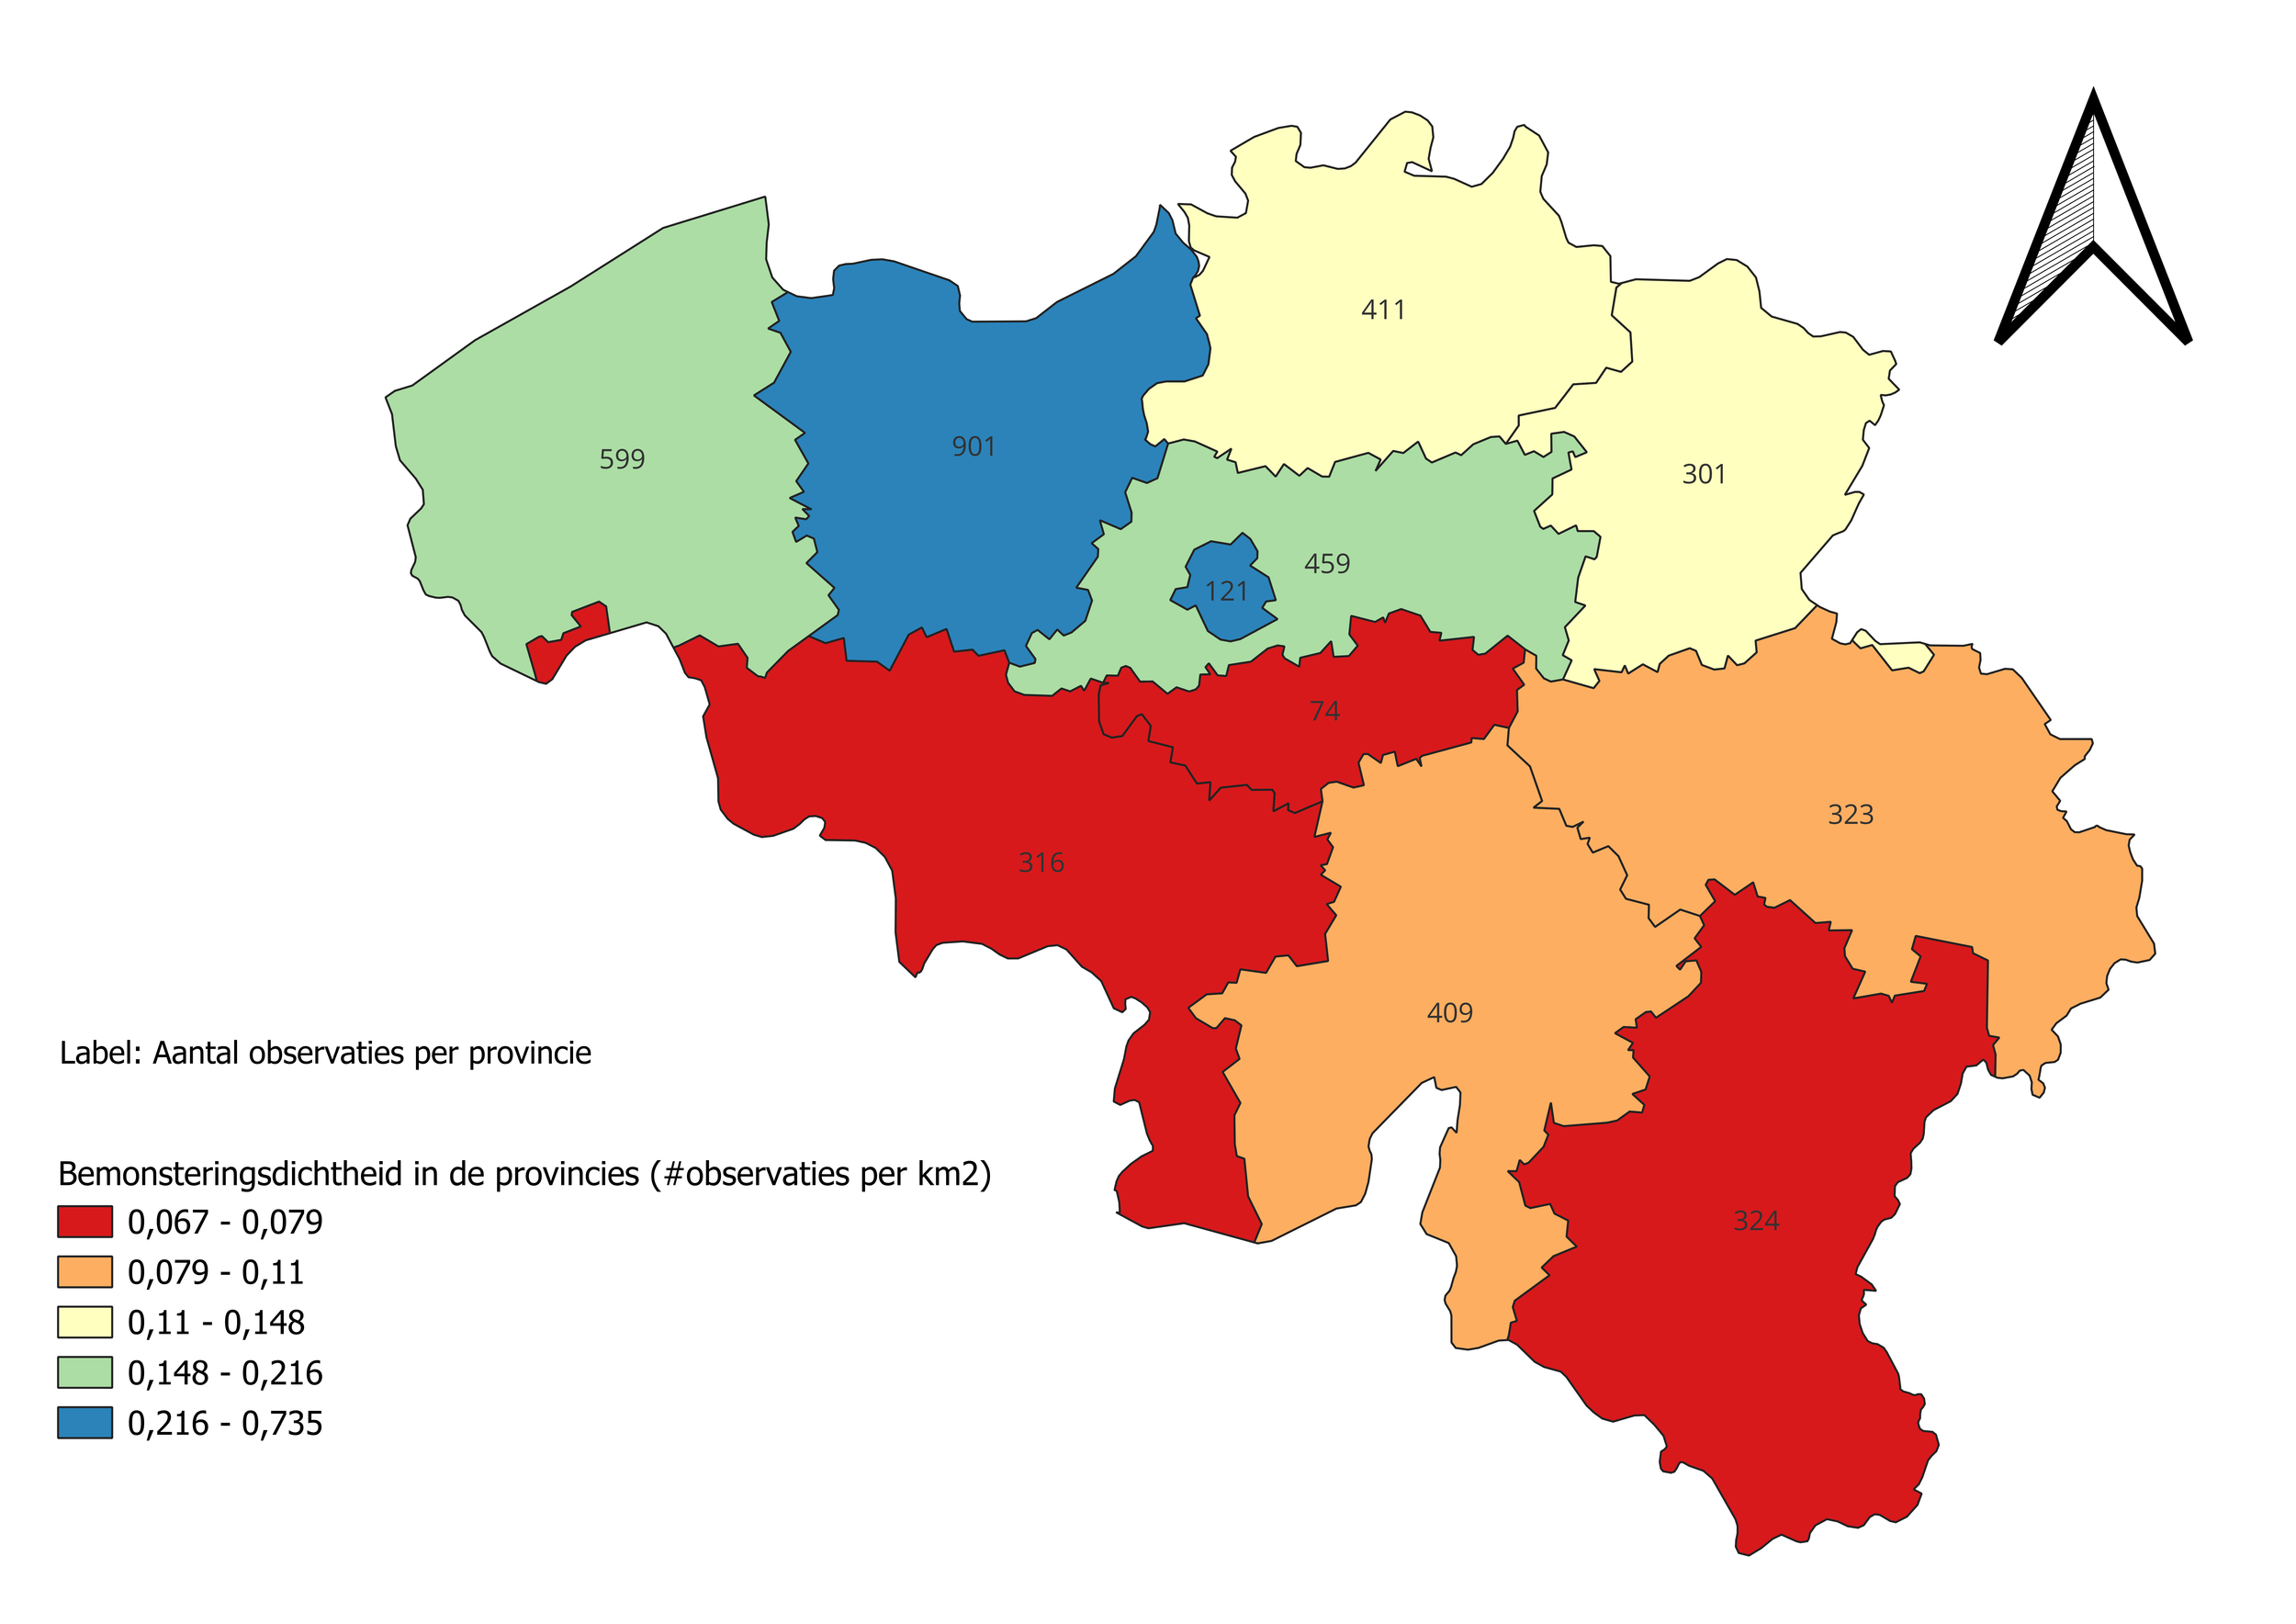
Er wordt geschat dat er in België waarschijnlijk tussen de 35 tot 44 soorten voorkomen. Meer inventarisatie en onderzoek, onder meer met eDNA en DNA technieken, is dus nodig om onontdekte soorten op te sporen, moeilijk te onderscheiden soorten te herkennen en toekomstige nieuwkomers te detecteren. Vooral in Wallonië en in de provincies Antwerpen en Limburg zijn er nog grote kennishiaten. In elk 10kmx10km UTM hok zijn er minstens 24 waarnemingen nodig om een volledig beeld te hebben van de verspreiding van regenwormen. Momenteel is deze hoeveelheid alleen behaald in 10% van de UTM hokken. De kaarten hieronder geven het aantal waarnemingen weer in elk UTM hok en elke provincie. Per provincie is de bemonsteringsdichtheid (#observaties/km²) via een kleurengradiënt weergegeven.
It is estimated that between 35 and 44 species are likely to occur in Belgium. Further inventory and research, including the use of eDNA and DNA techniques, are therefore needed to detect undiscovered species, identify species that are difficult to distinguish, and detect future newcomers. Particularly in Wallonia and in the provinces of Antwerp and Limburg, substantial knowledge gaps remain. At least 24 observations per 10 km × 10 km UTM grid square are needed to obtain a complete picture of earthworm distribution. Currently, this number has only been reached in 10% of the UTM grid squares. The maps below show the number of observations in each UTM grid square and each province. For each province, the sampling density (# observations/km²) is represented using a colour gradient.
Samenvattende poster voor de 2026 ISEE conferentie
———
Summarising poster for the 2026 ISEE conference

Bronnen
Buyck E., De Smedt P., Sanczuk P., Bracke J., Cottyn C., Desie E., De Vos B., Lock K., Magr L., Moereels L., Muys B., Soors J., Dehon F., Schelfhout S. (2026). The Belgian Earthworm Atlas: Updating a national inventory of earthworm diversity since Bouché (1978). [Manuscript in voorbereiding].
Bouché, M. (1978). Atlas provisoire des lombriciens de Belgique et des pays limitrophes. Faculté des sciences agronomiques de Gembloux. https://www.researchgate.net/publication/332970638_PU_57_Atlas_provisoire_des_lombrici ens_de_belgique_et_des_pays_limitrophes